
Independent analysis. This page may contain affiliate links.
Best Website Performance Tools
Website performance tools measure how fast your pages load, how they behave for real users, and whether they stay up. Speed affects search ranking, conversion, and trust, so monitoring it is a core part of running a site.
This guide compares the tools used most for synthetic testing, real-user monitoring, and uptime checks.
Quick comparison table
| Option | Best for | Starting price |
|---|---|---|
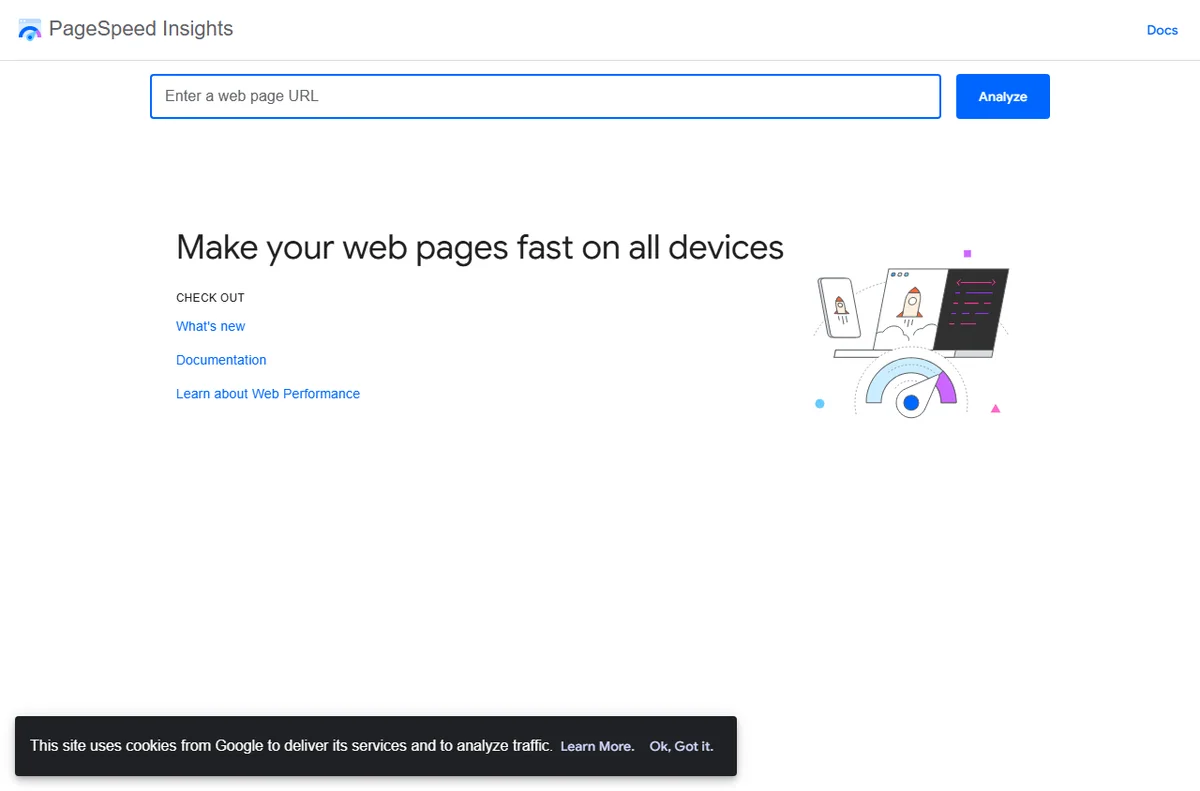
| PageSpeed Insights | Free Core Web Vitals checks | Free |
| Google Search Console | Field data and indexing | Free |
| GTmetrix | Quick synthetic performance reports | Free tier; paid plans available |
| WebPageTest | Deep diagnostic testing | Free; paid plans available |
| Pingdom | Uptime and performance monitoring | Free trial; paid plans |
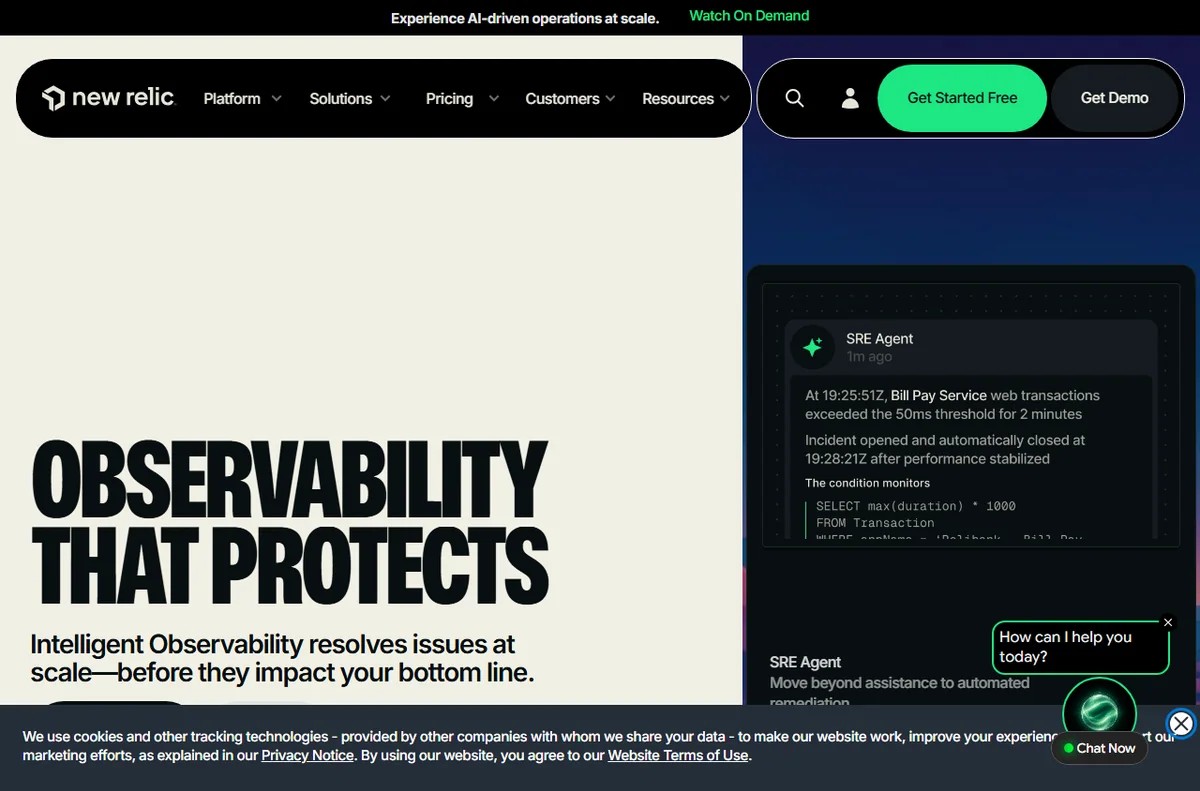
| New Relic | Application performance monitoring | Free tier; paid plans available |

Synthetic vs. real-user monitoring
Synthetic testing loads your page from controlled locations and devices, producing repeatable scores you can track over time. PageSpeed Insights, GTmetrix, and WebPageTest work this way. Real-user monitoring, or RUM, collects data from actual visitors, showing what real devices and networks experience.
Synthetic tests catch regressions in the lab, while RUM reflects the field. Serious teams use both, because a fast lab score does not guarantee a fast experience for every visitor.

Core Web Vitals and what to measure
Google’s Core Web Vitals, which include Largest Contentful Paint, Interaction to Next Paint, and Cumulative Layout Shift, are the metrics Google uses as user-experience ranking signals. Beyond those, watch time to first byte, total page weight, and the number and size of requests.
Tools increasingly surface Core Web Vitals directly, so you can prioritize fixes that move both user experience and search performance. Mobile results usually lag desktop, so test both.
Uptime and monitoring
Uptime monitoring pings your site at intervals and alerts you when it goes down or slows. Pingdom, Uptrends, and similar services offer this alongside performance checks. Pair uptime alerts with error tracking so you know not just that the site is down but why.
For applications, platforms like New Relic and Datadog add tracing that pinpoints slow database queries or API calls. Alerts should reach the people who can act, with thresholds tuned to avoid fatigue.

Diagnosing and fixing slowdowns
When a tool flags a problem, work from the largest impact down. Heavy images are the most common cause, so compress and serve modern formats, and load them lazily. Reduce render-blocking scripts and CSS, enable caching and a CDN, and defer non-critical JavaScript.
Watch third-party tags, which often dominate page weight. Fix one thing, retest, and confirm the metric improved; without that loop you are guessing.
Choosing the right tool
Start free: PageSpeed Insights and Google Search Console cover Core Web Vitals and field data at no cost. Add WebPageTest for deep diagnostics and a specialized tool such as DebugBear or SpeedCurve for ongoing tracking and performance budgets.
Layer in uptime monitoring once your site is business-critical. Match the tool to the job, whether lab testing, field data, or availability, rather than buying the largest suite.
Pros
- Free tools like PageSpeed Insights give instant Core Web Vitals data
- Synthetic tests produce repeatable scores for tracking regressions
- RUM shows the real experience across devices and networks
- Uptime monitoring catches outages before customers report them

Cons
- Lab scores do not always match field performance
- Enterprise monitoring platforms are costly for small sites
- Third-party scripts can dominate load and are hard to control
Frequently asked questions
What is the best free website speed tool?
Google PageSpeed Insights and Google Search Console are free and report Core Web Vitals and field data. GTmetrix and WebPageTest also offer free tiers.
What are Core Web Vitals?
They are Google’s user-experience metrics: Largest Contentful Paint for loading, Interaction to Next Paint for responsiveness, and Cumulative Layout Shift for visual stability.
Do I need paid monitoring?
Only once downtime or slowness has real business cost. Free tools cover speed testing; paid platforms add uptime alerts, historical trends, and deeper diagnostics.
How do I improve my site speed?
Compress and lazy-load images, minimize render-blocking scripts and CSS, use caching and a CDN, and limit third-party tags. Retest after each change.
Verdict
Use free tools to measure Core Web Vitals, add synthetic and real-user monitoring for ongoing tracking, and layer in uptime alerts if the site is business-critical. Fix the biggest bottleneck first, then retest.
Read more: speed optimization · website monitoring.